Analytics Dashboard
Comprehensive guide to understanding and using the Analytics Dashboard for monitoring AI chatbot performance, voice calls, campaign analytics, and user engagement metrics across all channels.
Overview
The Analytics Dashboard provides comprehensive insights into your AI chatbot platform performance, including voice calls, chat interactions, campaign analytics, and user engagement metrics. This powerful tool helps you understand user behavior, track performance trends, and optimize your AI interactions across all channels.
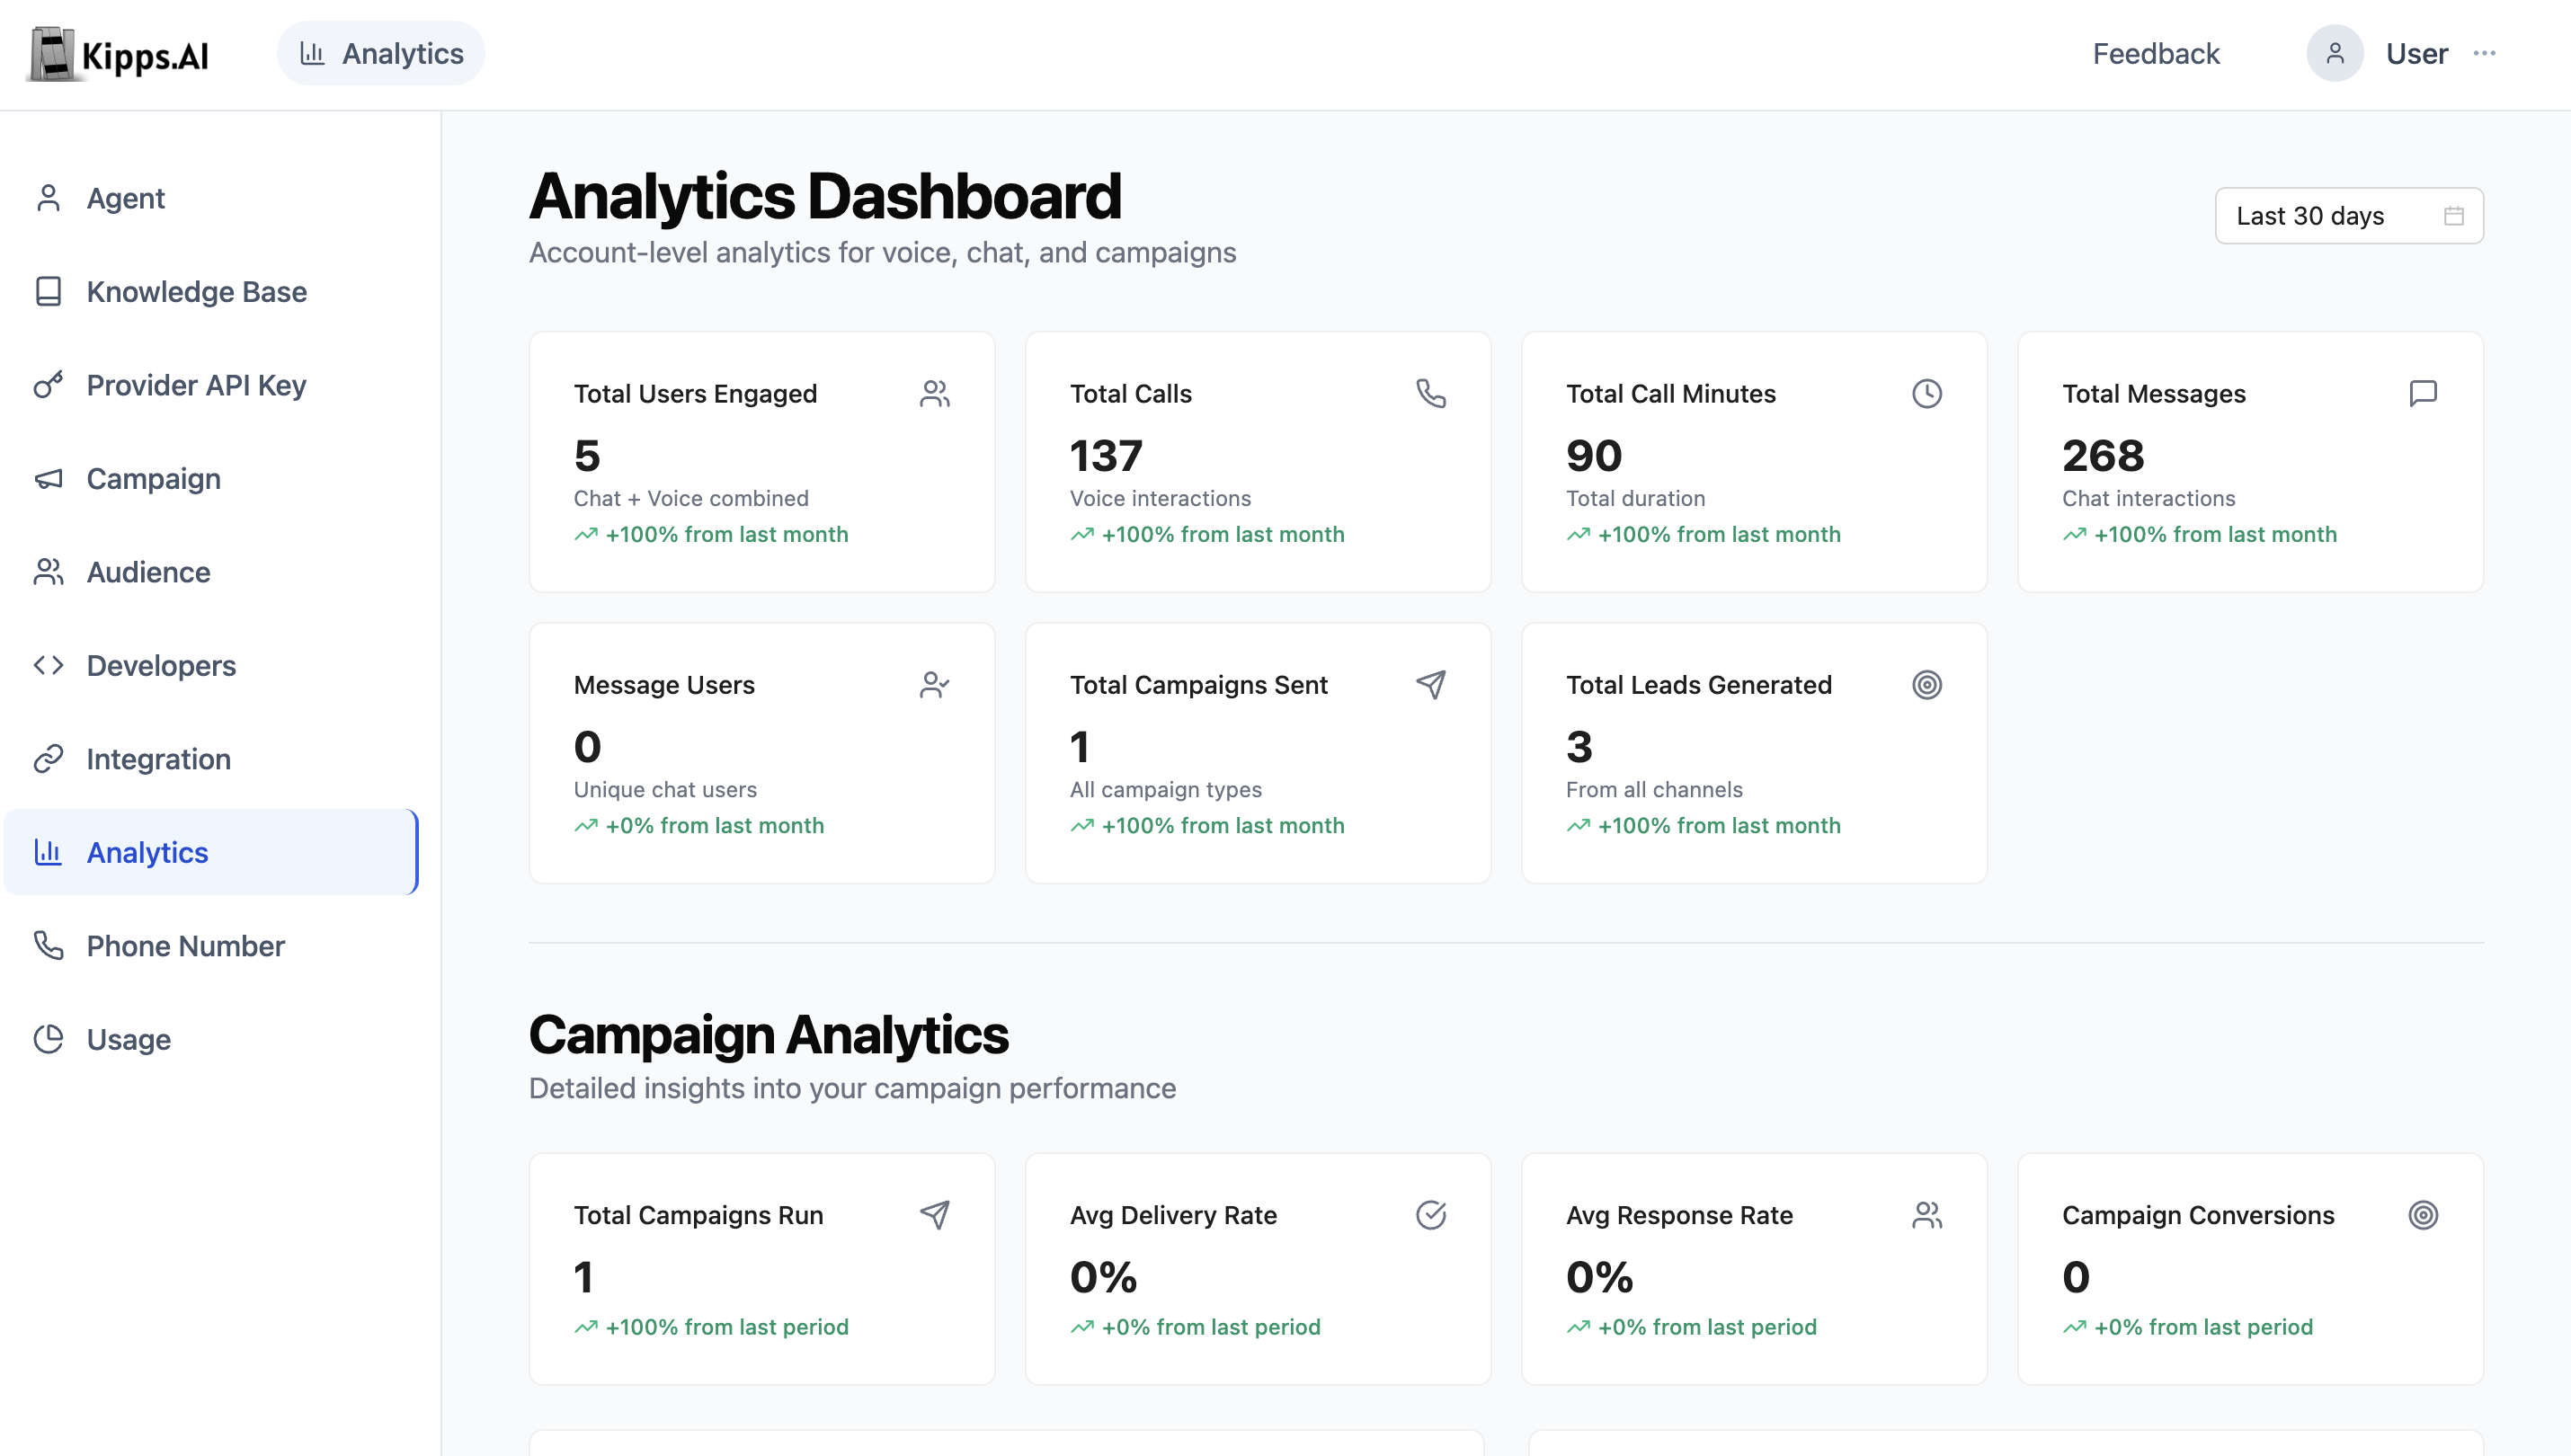
Accessing the Analytics Dashboard
- Navigate to Analytics: From the main navigation menu, click on the "Analytics" tab
- Authentication: Ensure you're logged in with your account credentials
- Dashboard Loading: The dashboard will automatically load with default metrics for the last 30 days
Dashboard Layout
The Analytics Dashboard is organized into several key sections:
1. Header Section
The top section contains:
- Dashboard Title: "Analytics Dashboard" with descriptive subtitle
- Time Range Selector: Choose from predefined periods or custom date ranges
- Date Picker: For custom date range selection (appears when "Custom Range" is selected)
2. Overview Metrics Cards
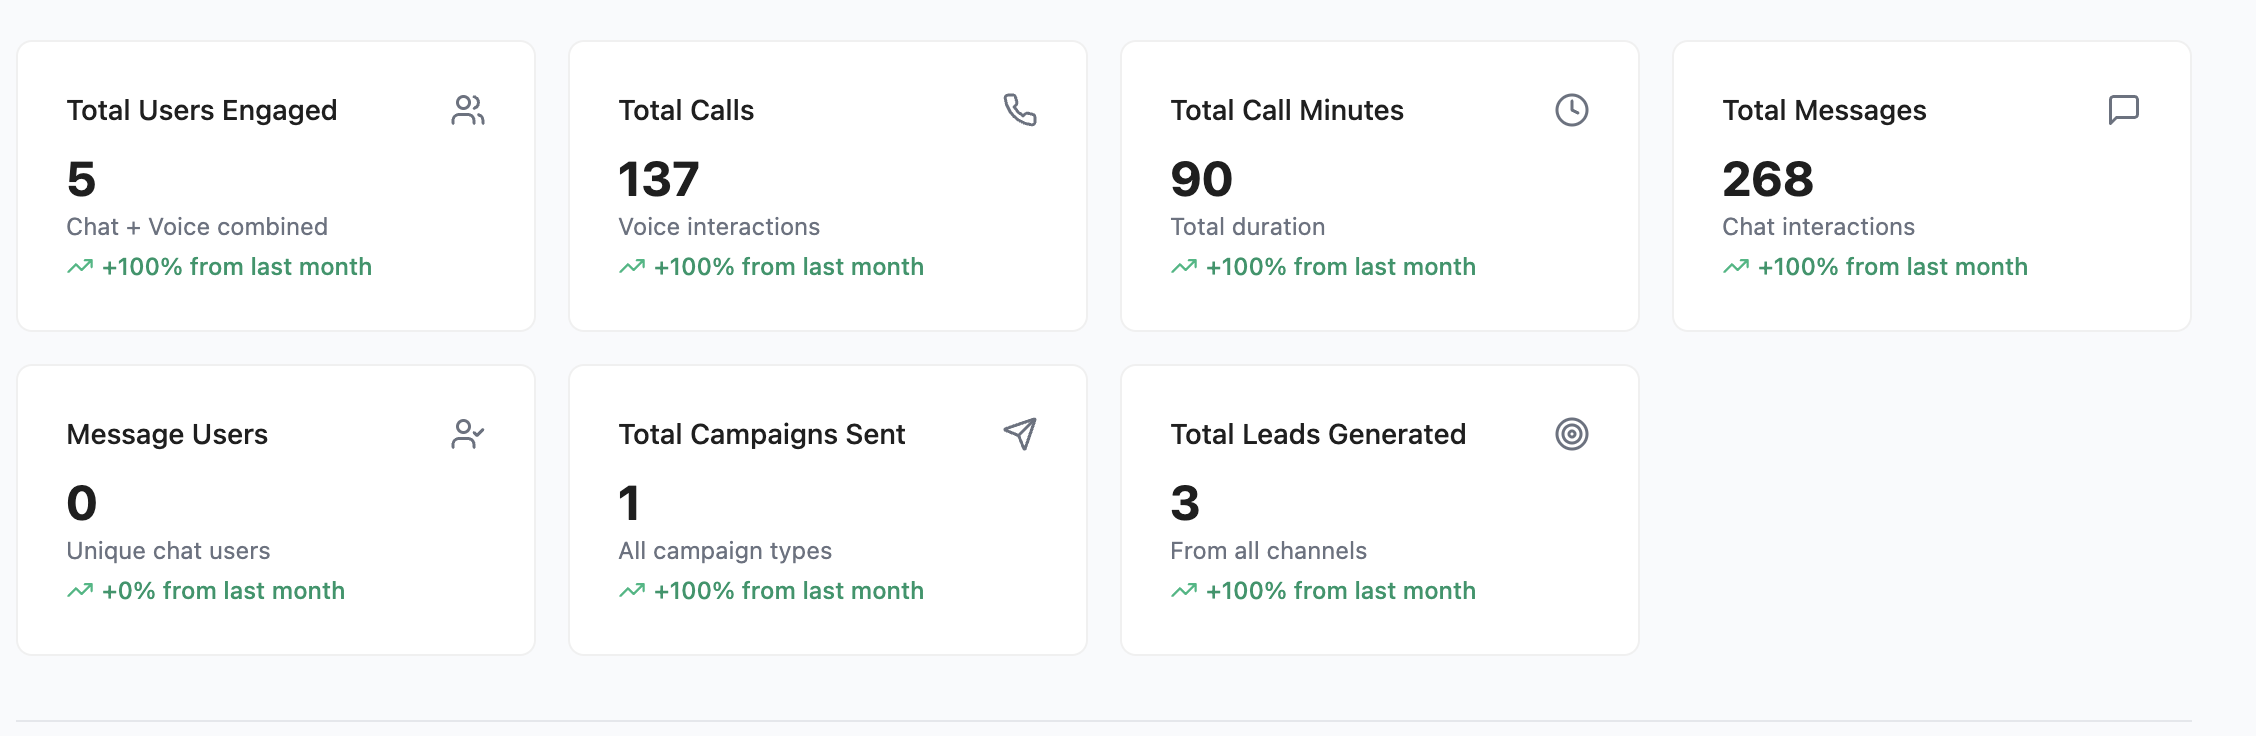
The main dashboard displays four key performance indicators in card format:
Total Users Engaged
- What it shows: Combined count of users who interacted with your chatbots and voicebots
- Icon: Users icon
- Trend indicator: Percentage change from previous period
- Description: "Chat + Voice combined"
Total Calls
- What it shows: Number of voice interactions completed
- Icon: Phone icon
- Trend indicator: Percentage change from previous period
- Description: "Voice interactions"
Total Call Minutes
- What it shows: Total duration of all voice calls
- Icon: Clock icon
- Trend indicator: Percentage change from previous period
- Description: "Total duration"
Total Messages
- What it shows: Number of chat interactions
- Icon: Message icon
- Trend indicator: Percentage change from previous period
- Description: "Chat interactions"
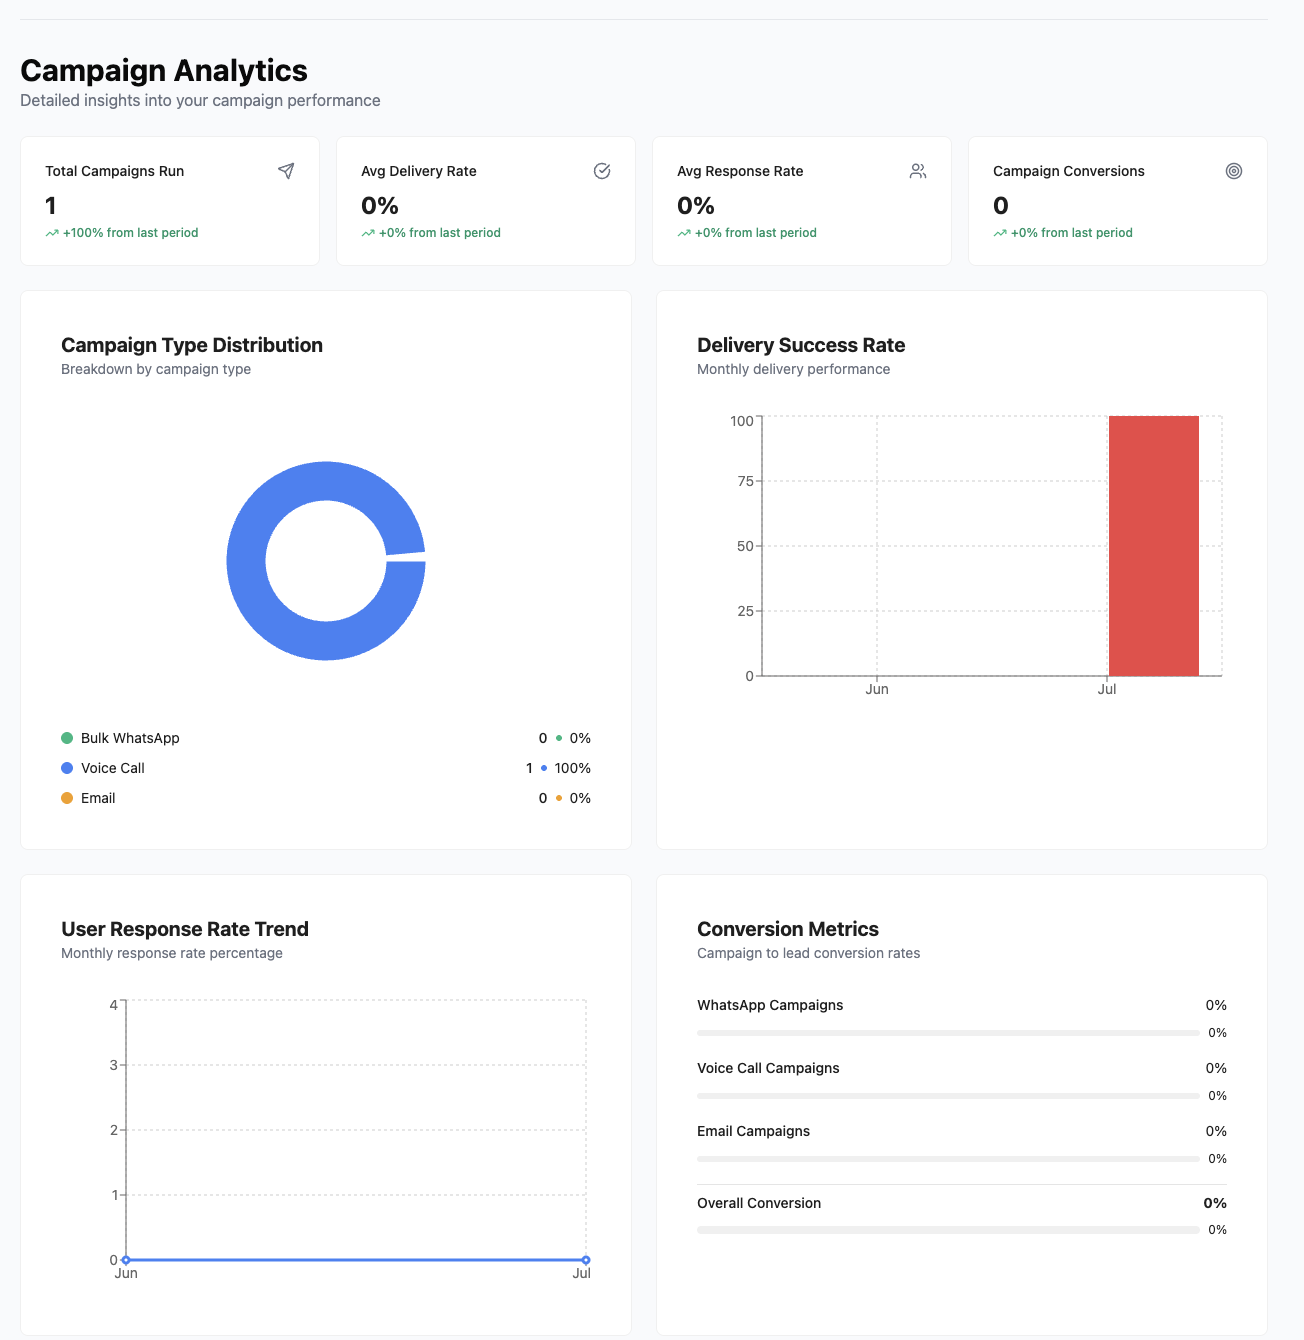
3. Campaign Analytics Section
This section provides detailed insights into your marketing campaigns:
Campaign Types Distribution
- WhatsApp Campaigns: Number of campaigns using WhatsApp integration
- Voice Campaigns: Number of campaigns using voice bots
- Email Campaigns: Number of traditional email campaigns
Delivery and Response Metrics
- Delivery Rate: Percentage of successfully delivered messages
- Response Rate: Percentage of recipients who responded
- Failed Deliveries: Number of undelivered messages
Conversion Data
- Overall Conversion Rate: Percentage of leads converted to "Hot" status
- Channel-specific Rates: Separate conversion rates for WhatsApp, Voice, and Email campaigns
4. Performance Summary
A comprehensive overview of key performance indicators with status indicators:
- Green indicators: Positive performance trends
- Red indicators: Declining performance
- Yellow indicators: Stable performance
Each metric shows:
- Current value
- Trend direction (up/down/stable)
- Percentage change

Time Range Selection
Predefined Ranges
- Last 7 days: Shows data for the past week
- Last 30 days: Default view showing monthly data
- Last 90 days: Quarterly view for trend analysis
- Custom Range: Select specific start and end dates
Custom Date Range
- Select "Custom Range" from the dropdown
- Use the date picker to select start and end dates
- The dashboard will automatically refresh with the new data range
Data Interpretation
Understanding Trends
Positive Trends (Green)
- Upward arrows indicate improvement
- Higher engagement, conversion rates, or user activity
- Good performance indicators
Negative Trends (Red)
- Downward arrows indicate decline
- Lower engagement or conversion rates
- Areas that may need attention
Key Metrics Explained
User Engagement
- Total Users: Unique individuals who interacted with your bots
- Active Users: Users who engaged within the selected time period
- Returning Users: Users who have interacted multiple times
Call Performance
- Total Calls: Number of voice interactions initiated
- Call Duration: Average length of voice conversations
- Call Drop-off Rate: Percentage of calls that ended prematurely
Message Performance
- Total Messages: Number of chat interactions
- Response Rate: How quickly your bot responds to users
- Completion Rate: Percentage of conversations that reached a conclusion
Troubleshooting
Common Issues
No Data Available
- Cause: No interactions in the selected time range
- Solution: Try expanding the time range or check if bots are active
Loading Errors
- Cause: Network connectivity or authentication issues
- Solution: Refresh the page or log in again
Missing Metrics
- Cause: Specific features not enabled or no data for that metric
- Solution: Enable the required features or wait for data collection
Error Messages
Authentication Failed
- Message: "Authentication failed. Please log in again."
- Solution: Log out and log back in with valid credentials
API Endpoint Not Found
- Message: "Analytics API endpoint not found."
- Solution: Contact support if the issue persists
Connection Issues
- Message: "Failed to connect to the server."
- Solution: Check your internet connection and try again
Best Practices
Regular Monitoring
- Check analytics daily for immediate issues
- Review weekly trends for pattern recognition
- Analyze monthly data for strategic insights
Performance Optimization
- Monitor conversion rates and optimize low-performing campaigns
- Track response times and improve bot efficiency
- Analyze user engagement patterns to enhance user experience
Data-Driven Decisions
- Use trend data to allocate resources effectively
- Identify peak usage times for capacity planning
- Leverage conversion insights for campaign optimization
Support and Resources
Getting Help
- Documentation: Refer to this user guide for detailed instructions
- Support Team: Contact support for technical issues
- Community: Join user forums for best practices and tips
Additional Resources
- Video Tutorials: Step-by-step walkthroughs
- Knowledge Base: Comprehensive FAQ and troubleshooting guides
This documentation covers the main Analytics Dashboard functionality. For specific feature details or advanced configurations, please refer to the respective feature documentation or contact our support team.
Frequently Asked Questions
How frequently is the data in the Analytics Dashboard updated? Analytics data is updated in near real time for active calls and chat sessions. Summary metrics such as daily totals and trend indicators typically refresh within a few minutes after interactions complete. Custom date range filters also query the latest available data at the time of the request.
Can I compare performance across two different time periods? Yes. Use the Time Range Selector to switch between predefined periods and compare trends. To perform a side-by-side comparison, note the metrics for one period, then switch the date range to the comparison period. Direct visual comparison in a single view is available via the trend percentage indicators shown on each KPI card.
Why does the "Total Users Engaged" number differ from my campaign's reported contact count? Total Users Engaged in the global Analytics Dashboard counts unique users across both chat and voice channels. Campaign-level analytics count total participants including retry attempts and contacts reached. A single user who engaged in both chat and a voice campaign will be counted once in the global metric but separately in each channel's report.
Can I export the full analytics data, not just a PDF snapshot? The current export feature generates a PDF report of the dashboard view. For raw data export (CSV), use the individual agent dashboards (Voice Agent Analytics, AI Chat Agent Analytics) which provide lead and conversation data exports.
Why are some metrics showing "Coming Soon" in the dashboard? Certain advanced analytics features are still being developed. The "Coming Soon" label indicates planned metrics such as channel-level attribution breakdowns or call quality scoring. These will become available in future platform updates.