VoiceAgent – Analytics Overview
Understand how to track and analyze your VoiceAgent's performance and user engagement using the built-in Analytics Dashboard.
VoiceAgent Analytics: Understanding Performance and Engagement
The Analytics dashboard provides a comprehensive overview of your VoiceAgent's performance, user engagement, and operational metrics. By visualizing key data points, this page helps you understand how your agent is being used, identify areas for improvement, and measure its overall effectiveness.
From high-level summaries to detailed hourly breakdowns, these analytics are crucial for optimizing your VoiceAgent's instructions, functions, and user experience.
How to Access the Analytics Dashboard
- From your VoiceAgent's main dashboard, click on "Analytics" in the navigation menu.
- This will load the main analytics dashboard for that specific VoiceAgent.
Filtering Your Data
At the top of the page, you'll find options to filter the entire dashboard by a specific time frame. This allows you to analyze performance over different periods.
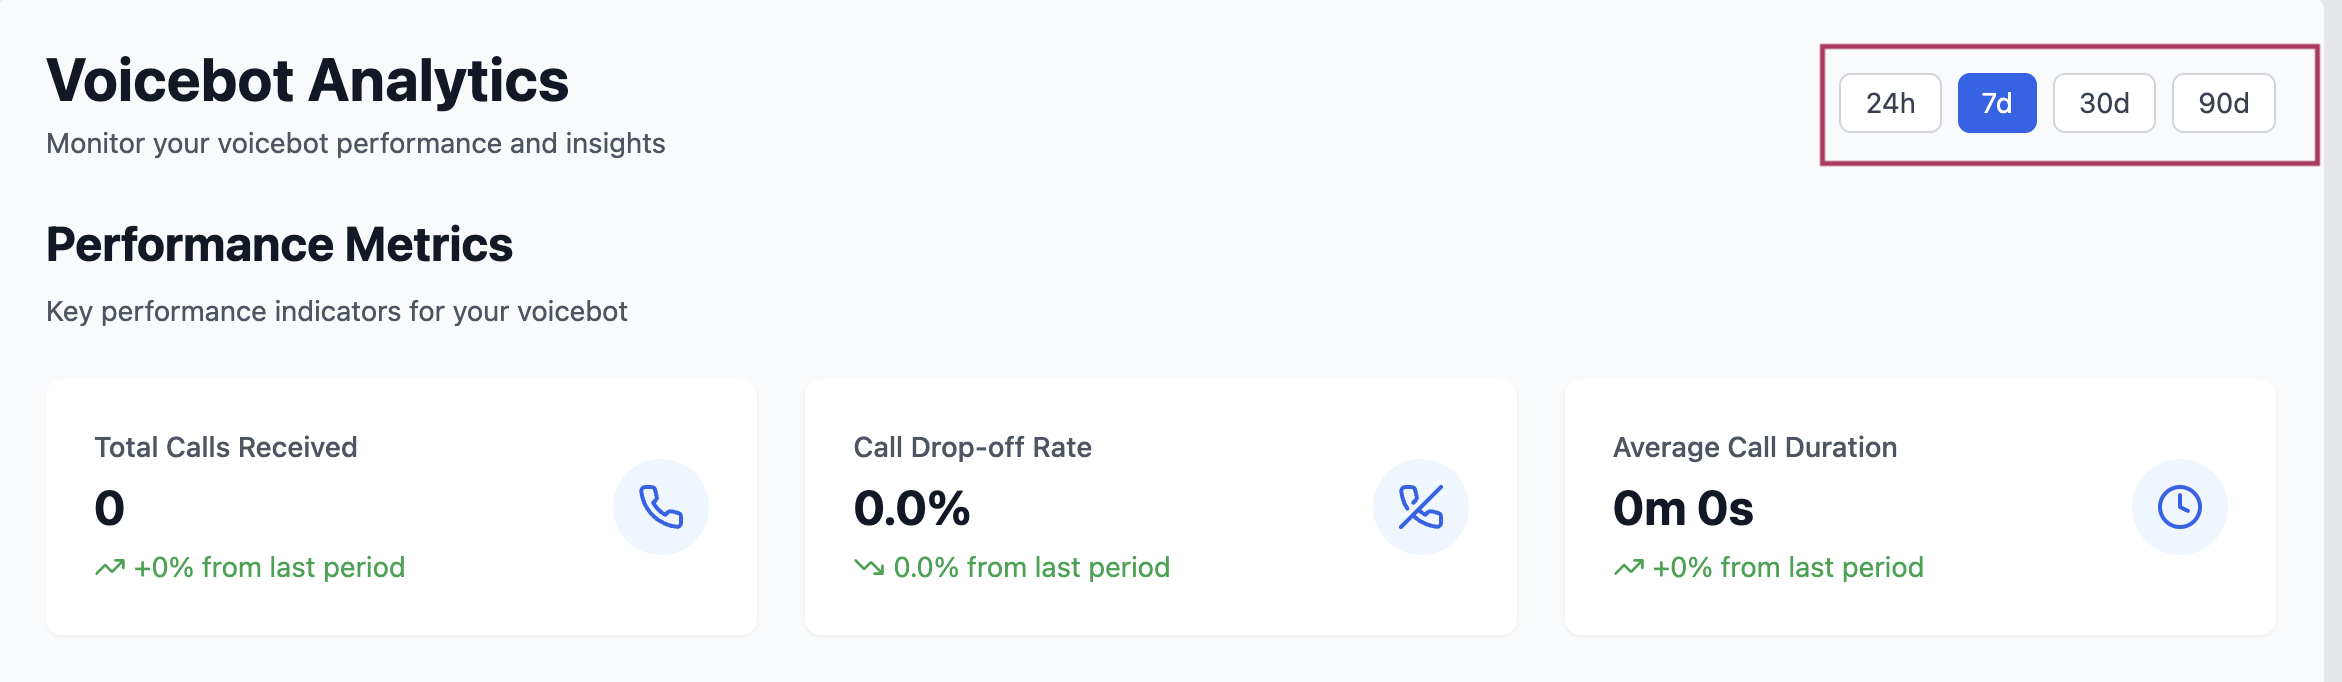
- Time Range: Choose from predefined periods like "24h", "7d", "30d", or "90d" to see data for the last day, week, month, or quarter. The dashboard will update instantly to reflect your selection.
Key Analytics Sections
The dashboard is organized into several sections, each containing cards that highlight specific metrics.
1. Performance Metrics (Summary Cards)
This section gives you a quick, at-a-glance summary of your VoiceAgent's core performance indicators.
- Total Calls Received: The total number of calls your VoiceAgent has handled within the selected time frame. It also shows a trend percentage comparing it to the previous period.
- Call Drop-off Rate: The percentage of calls that were disconnected very quickly (e.g., within 5 seconds). A high rate might indicate issues with your initial message or connection quality.
- Average Call Duration: The average length of a conversation. This helps you understand how engaged users are.
2. Call Volume & Distribution
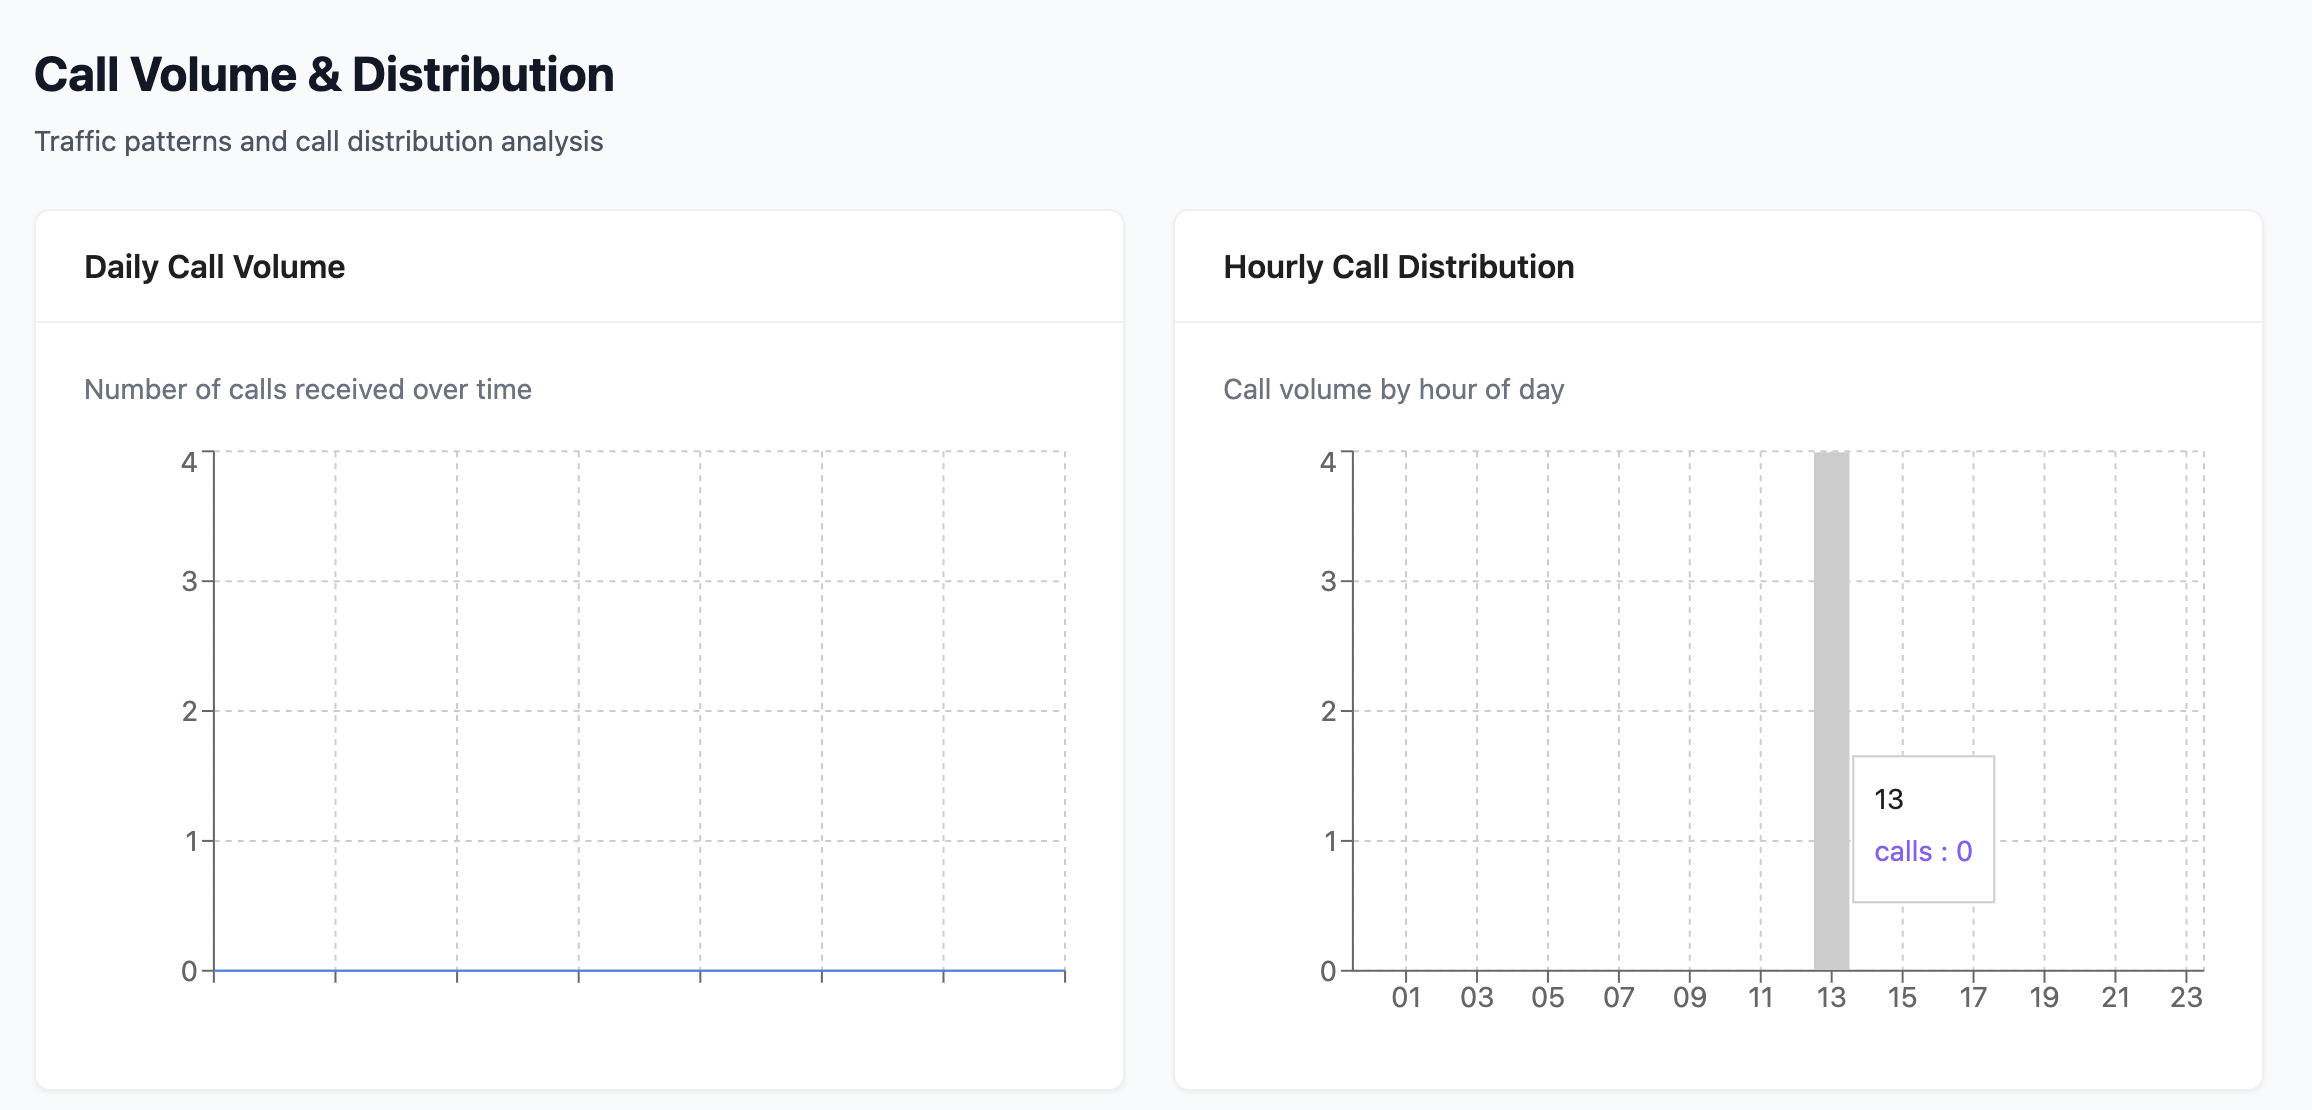
This section helps you understand traffic patterns and when your users are most active.
- Daily Call Volume: A line graph that plots the total number of calls received each day over the selected time period. This is useful for spotting trends, like an increase in calls after a marketing campaign.
- Hourly Call Distribution: A bar chart that shows the total number of calls for each hour of the day. This helps you identify your peak traffic hours.
3. Engagement & Understanding
This section focuses on the quality of the conversations and how well your agent understands user requests.
- Top Intents Handled: A list of the most common user goals or topics that your agent successfully identified during conversations (e.g., "Product Inquiry," "Technical Support").
- User Sentiment Analysis: (Coming Soon) A pie chart that will break down conversations by sentiment (Positive, Neutral, Negative).
- Fallback/Unknown Responses: (Coming Soon) A metric that will show how often your agent failed to understand a user's request.
4. Usage & Traffic Analytics
This section provides insights into your user demographics.
- Geographical Distribution: (Coming Soon) A breakdown of calls by country or region.
- New vs. Returning Users: A chart that compares the number of calls from first-time callers versus those who have called before.
5. Cost Analytics
(Coming Soon) This section will provide a detailed breakdown of the operational costs associated with your VoiceAgent, including:
- STT (Speech-to-Text) Cost: The cost of transcribing the user's speech.
- TTS (Text-to-Speech) Cost: The cost of generating the agent's voice.
- LLM (Large Language Model) Cost: The cost of the AI "brain" processing the conversation.
By regularly reviewing these analytics, you can make data-driven decisions to continuously improve your VoiceAgent, enhance user satisfaction, and maximize its value to your business.
Best Practices
- Start with the 7-day view: Use the 7-day filter as your default review window. It is long enough to smooth out single-day anomalies but short enough to catch a problem quickly.
- Watch the Call Drop-off Rate weekly: A rising drop-off rate often signals an issue with your opening message or connection quality. Investigate before it impacts user trust.
- Use Hourly Distribution to schedule maintenance: The bar chart shows your lowest-traffic hours—schedule knowledge base retraining or configuration changes during those windows to minimize user impact.
- Track Top Intents to prioritize content updates: If the same intents appear at the top week after week, ensure your knowledge base and agent instructions address them with the most current and accurate information.
Troubleshooting
The analytics dashboard is empty even though calls have been made. Ensure the calls were made to the correct voicebot. Analytics are scoped per-agent, so calls received by a different voicebot will not appear here. Also check the time range filter—if set to "24h" and all calls happened yesterday, switch to "7d".
Total Calls Received shows 0 despite inbound call activity. Confirm that the phone number linked to this voicebot has its Inbound SIP Status set to "Enabled" in the Phone Numbers tab. Calls routed to a non-enabled number will not be tracked.
The Top Intents section is empty. Top Intents are populated only after the agent has successfully handled a minimum number of conversations. New deployments may take a few days of traffic before this section shows meaningful data.
Average Call Duration appears much shorter than expected. Short average durations often reflect a high volume of very brief calls (immediate hang-ups or misdials). Filter these out by reviewing the Call Drop-off Rate and the individual call records in the Call History section.
Frequently Asked Questions
How often does the analytics data refresh? Analytics metrics update approximately every few minutes. The dashboard is not real-time—use the Call History page for the most recent individual call records.
Can I export analytics data to a CSV or spreadsheet? Export options depend on your plan. Contact support or use the Kipps.AI Developer API to retrieve analytics data programmatically for custom reporting.
What is the difference between the VoiceAgent Analytics page and the global Analytics page? The global Analytics page aggregates data across all agents. The VoiceAgent Analytics page is scoped to a specific voicebot, making it more useful for per-agent performance reviews.
Will upcoming features like Sentiment Analysis and Geographical Distribution apply retroactively? Once released, these features will analyze historical call data where possible. However, some data points (like sentiment scores) may only be available from the date the feature goes live.
How is the "Call Drop-off Rate" threshold defined? A call is counted as a drop-off if the user disconnects within the first 5 seconds of the conversation. This threshold is fixed and cannot currently be customized.
Related Articles