AI AI Chat Agent Agent Dashboard
The Kipps.AI AI Chat Agent Dashboard is a full-featured control center that empowers users to track AI Chat Agent interactions, capture lead data, analyze user engagement trends, and export insights with ease. Designed with a clean and modern user interface, the dashboard consolidates several tools into an intuitive experience that brings together conversation logs, lead management, and message analytics in one place. This documentation provides a detailed walkthrough of the core components and how each feature contributes to maximizing the potential of Kipps.AI's AI Chat Agent integration.
Chat Logs Panel
Overview
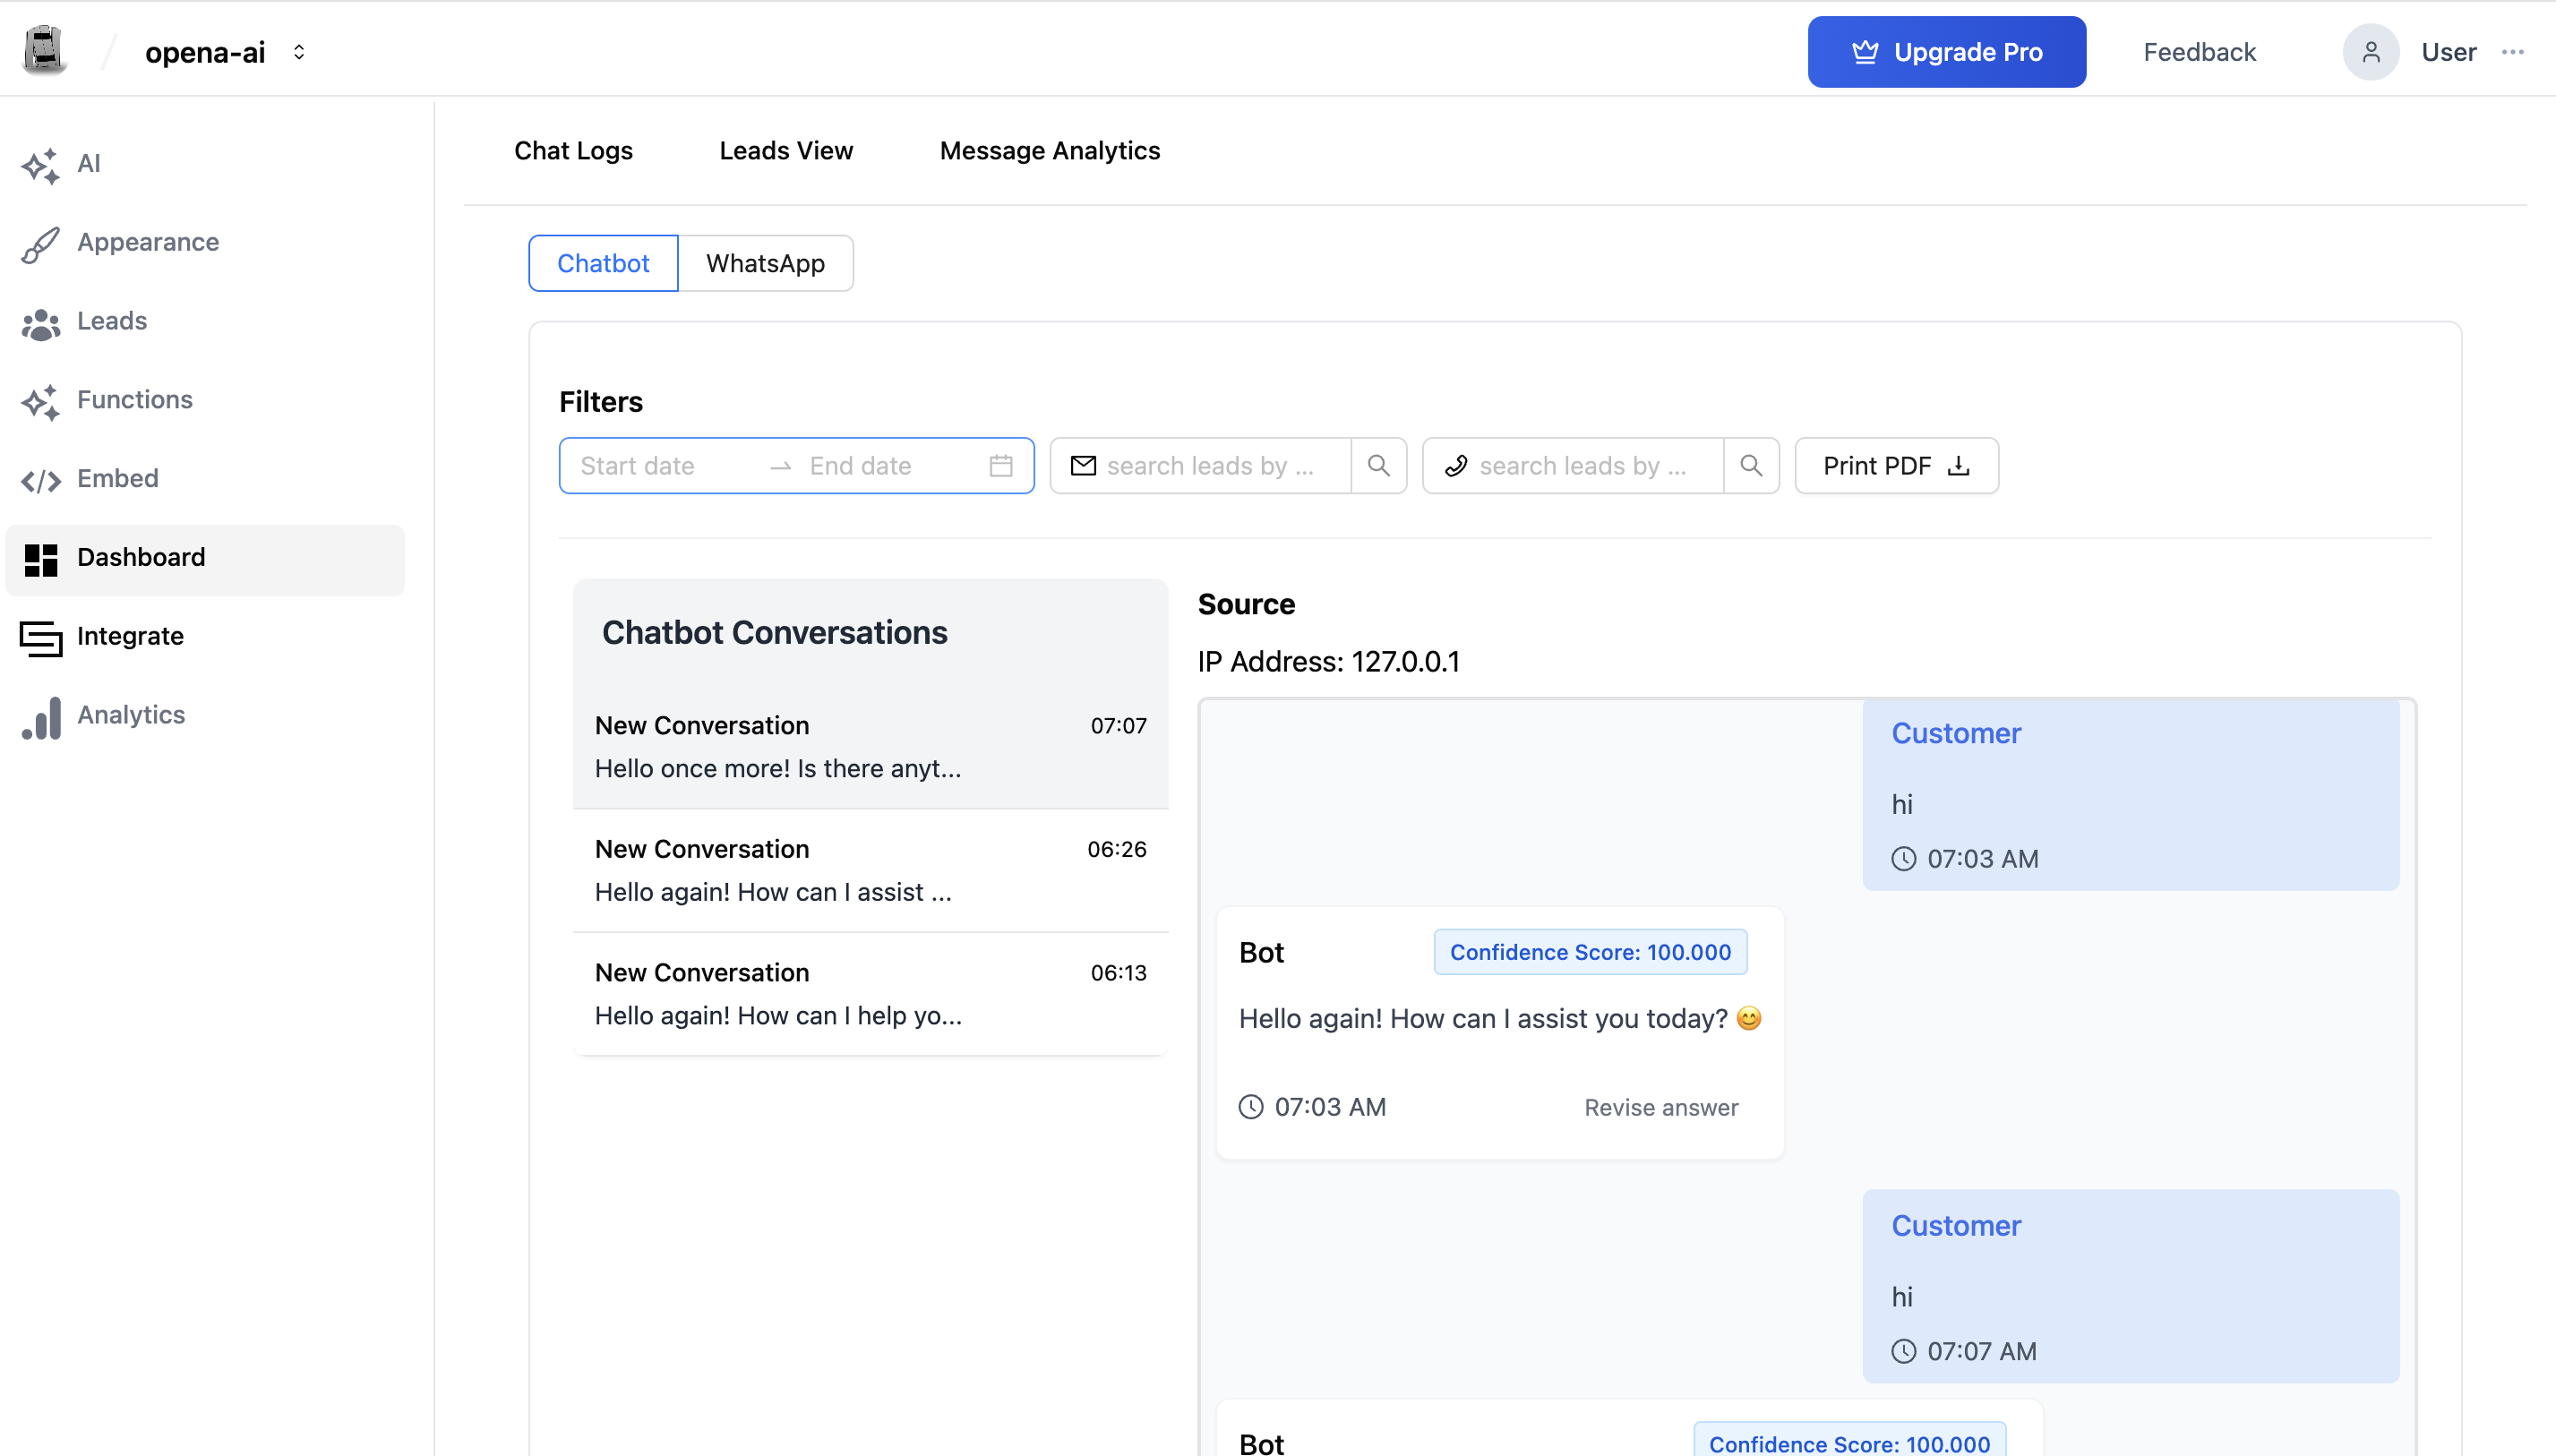
The Chat Logs section is the foundational layer of the dashboard, providing a chronological overview of all conversations handled by the AI Chat Agent. This area gives users visibility into each interaction, including both incoming messages and automated bot responses.
Key Features
- Conversation List: Displayed in a scrollable sidebar with timestamps and message previews.
- Conversation Viewer: Detailed view with timestamps, bot confidence scores, and message history.
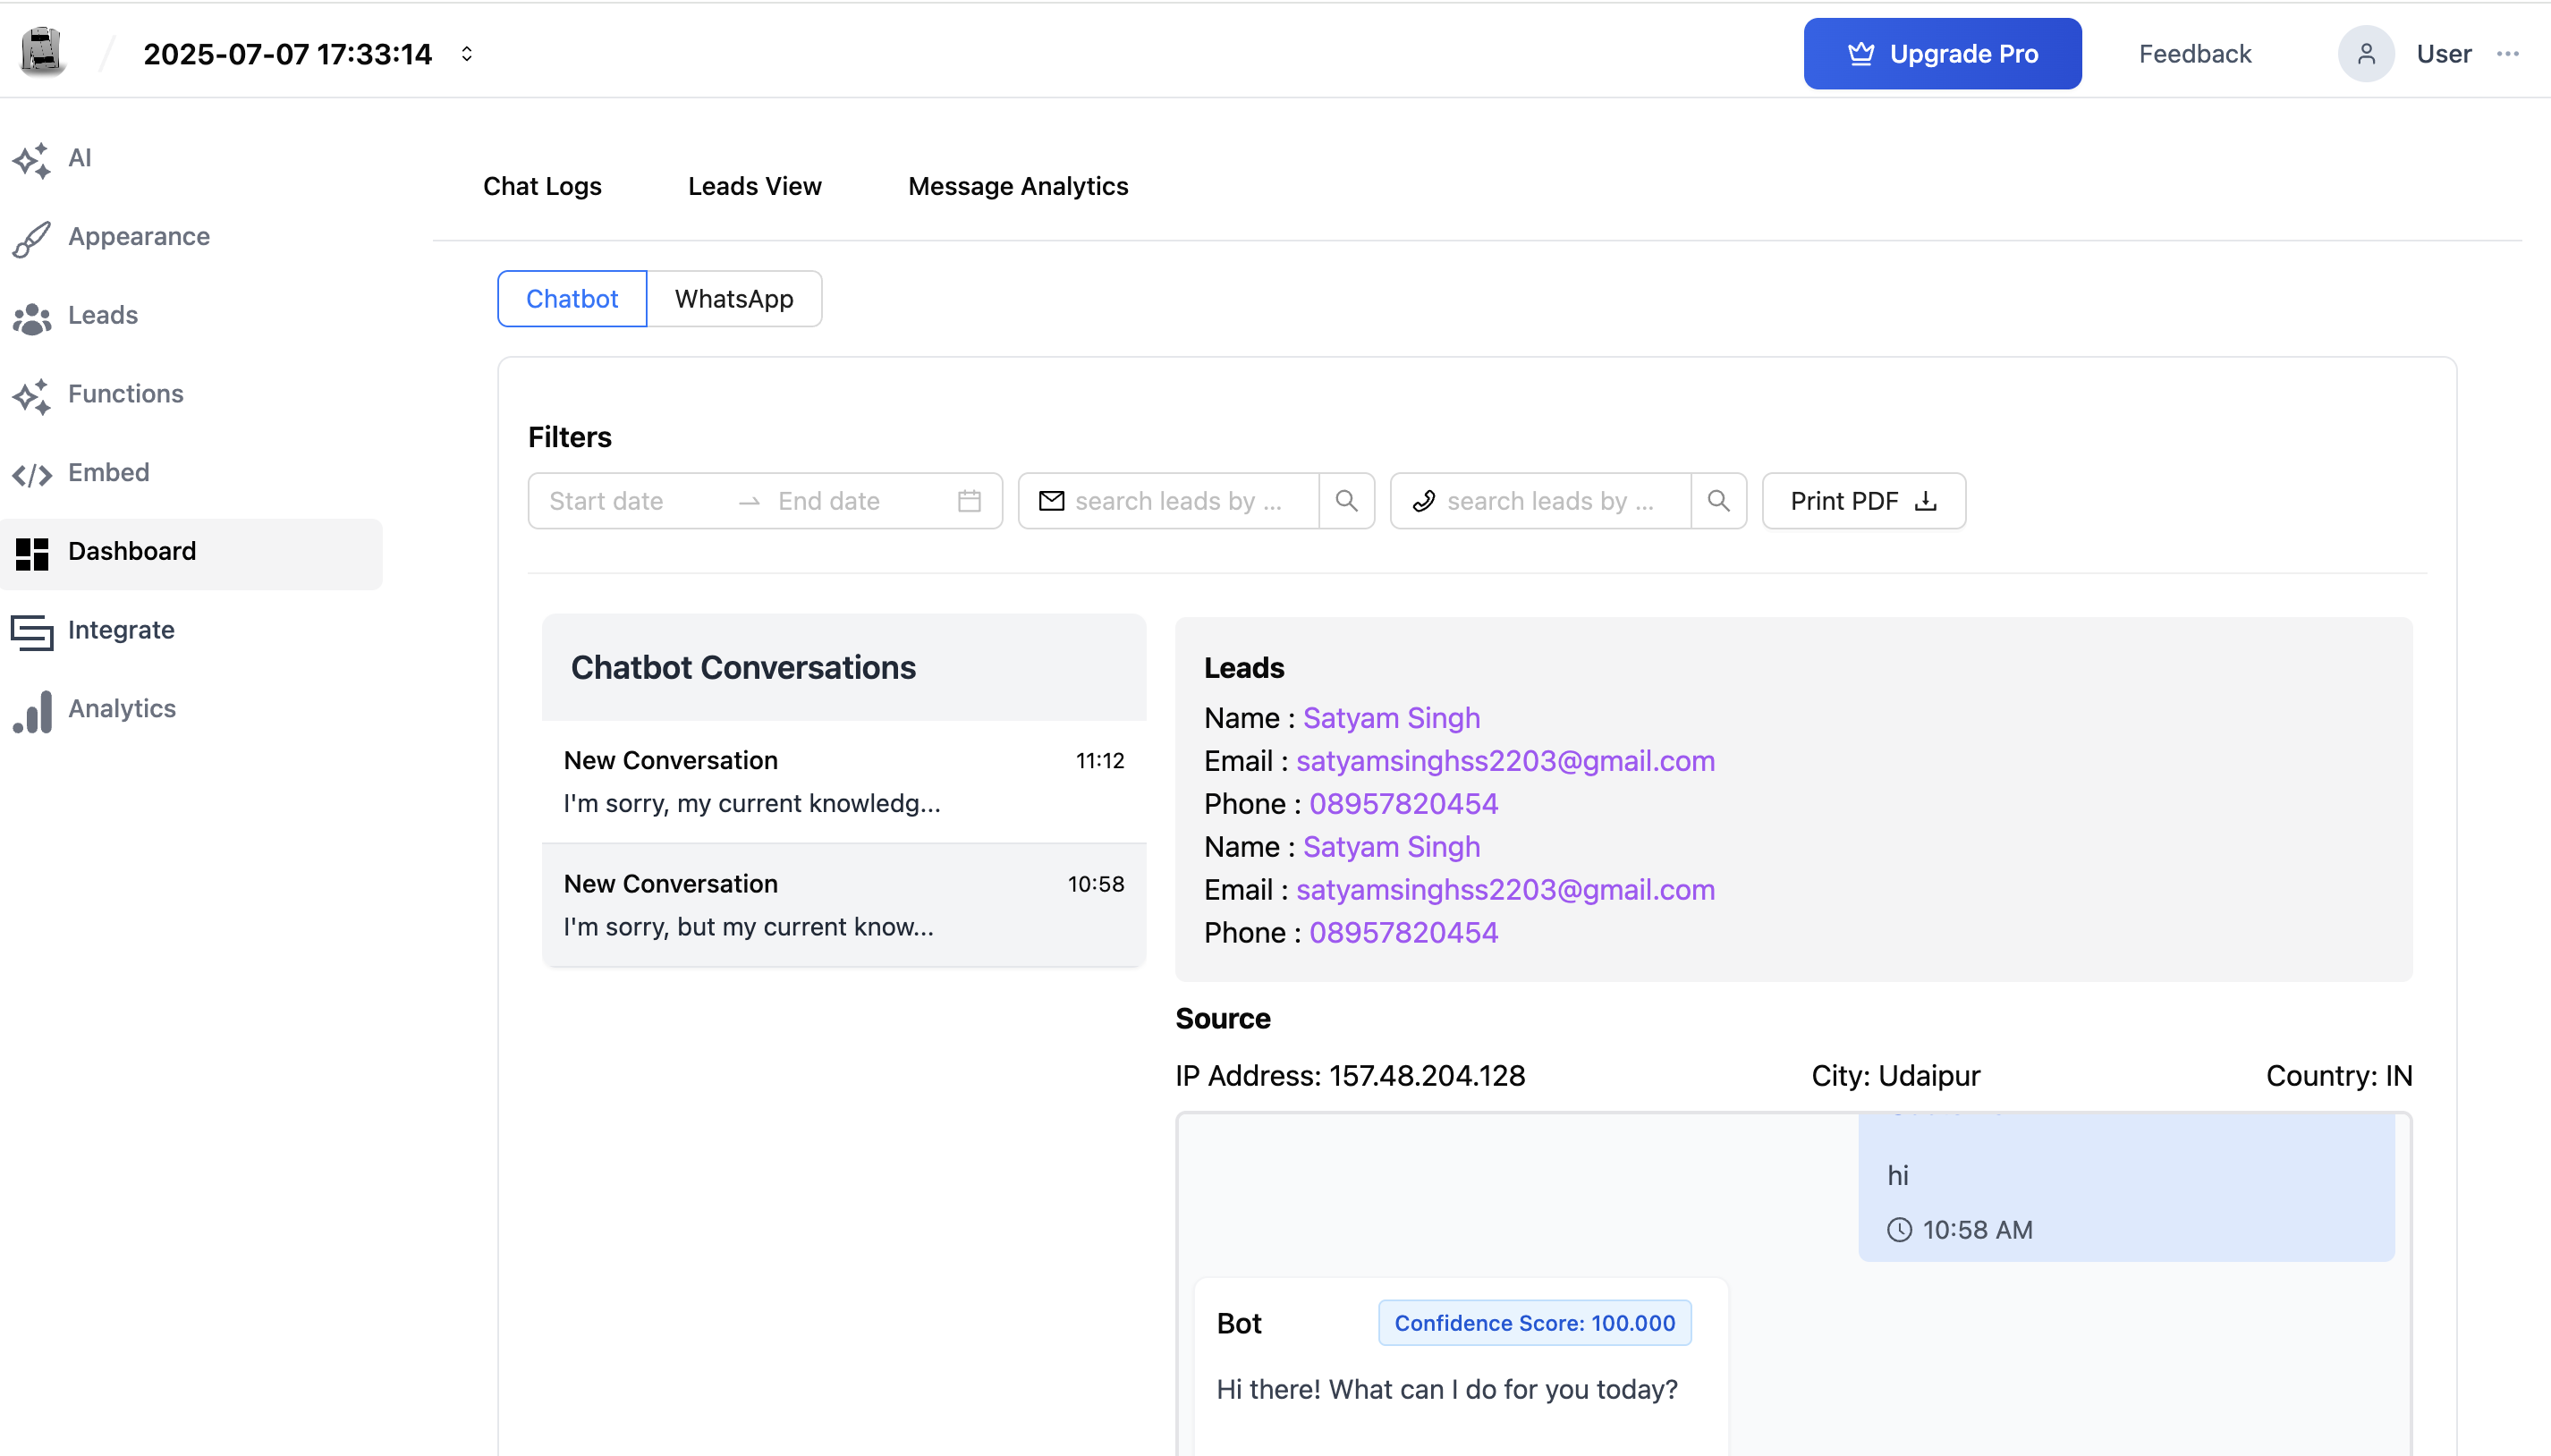
- Lead Auto-Detection: If a user provides contact info, it's shown alongside the chat dynamically.
- Channel Tabs: Switch between AI Chat Agent and WhatsApp conversation logs.
- Search & Filter: Filter by date range, email, or URL.
- PDF Export: Export filtered conversation histories.
Example View
Leads View Panel
Overview
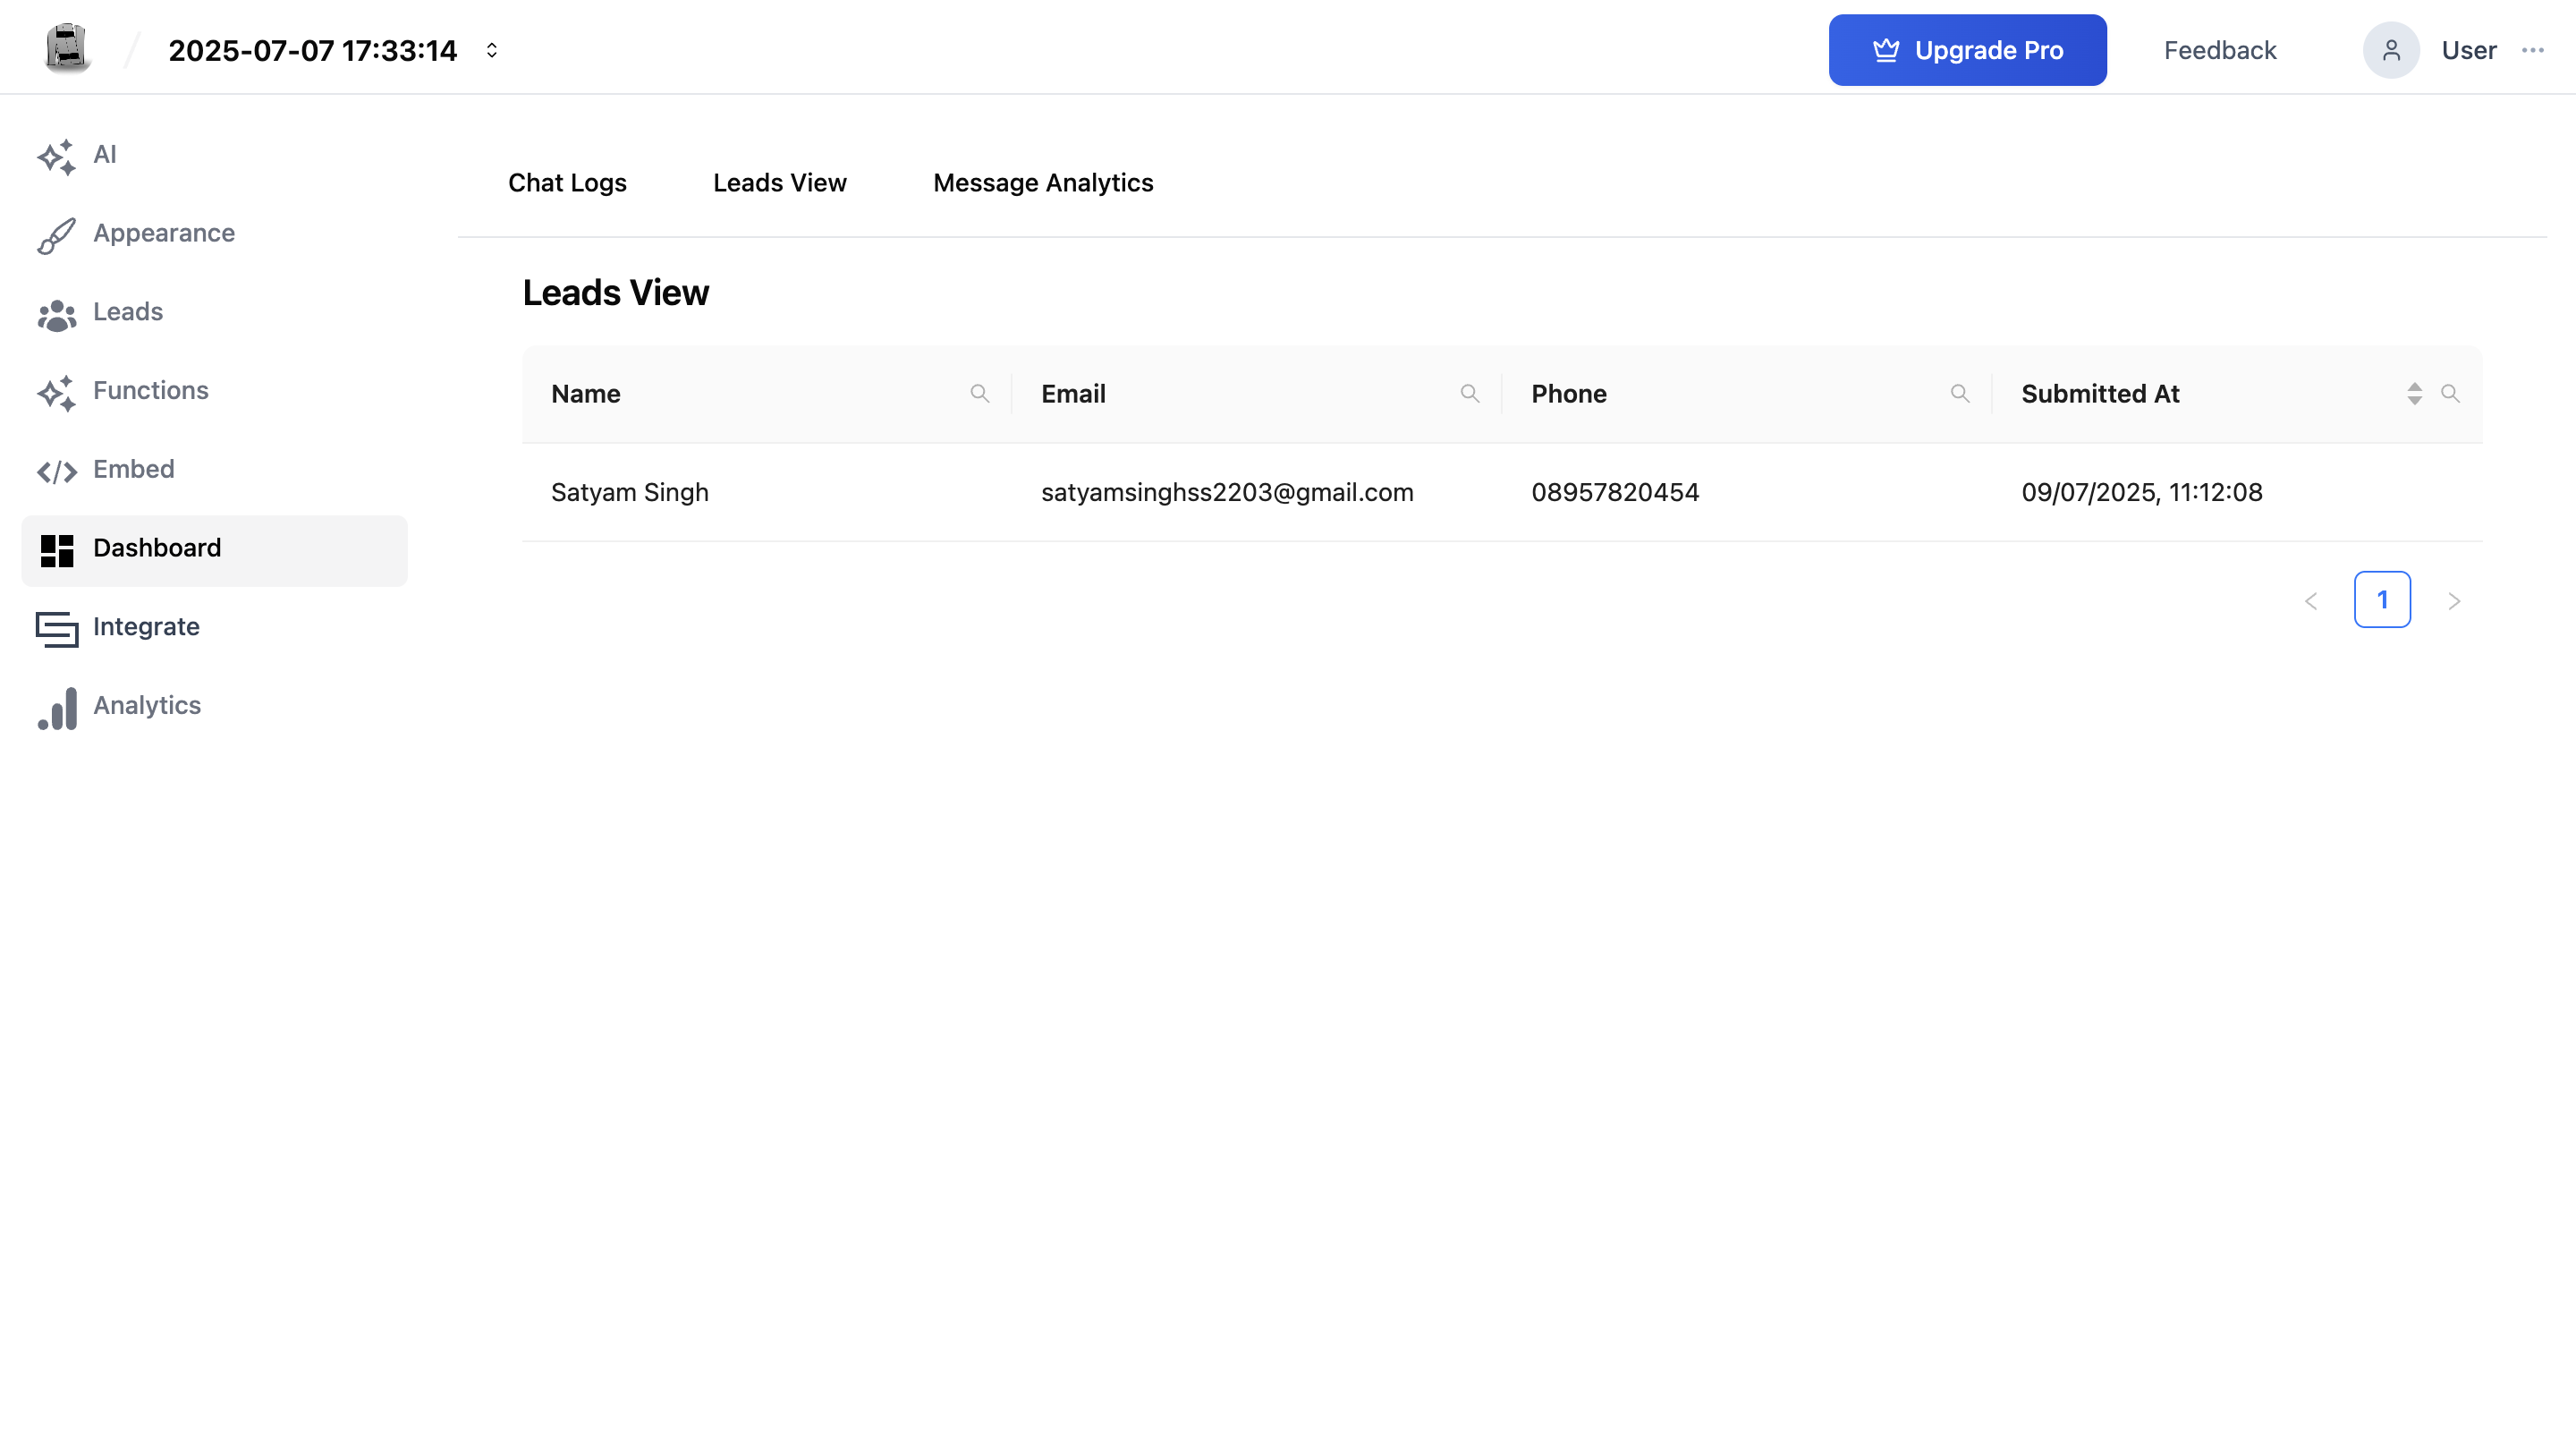
Leads View displays all captured leads from AI Chat Agent interactions. When users share their contact details, the system stores this data in real-time.
Data Fields
- Name
- Phone
- Submitted At
Features
- Real-Time Sync: Leads populate immediately during active conversations.
- Structured Table: All lead data is shown in a tabular format with searchable columns.
- Sort & Filter: Easily organize and find leads based on any field.
Use Cases
Perfect for marketing and sales teams to follow up on leads, run email campaigns, or export to CRM.
Example View
Message Analytics: Drive Strategy with Actionable Data
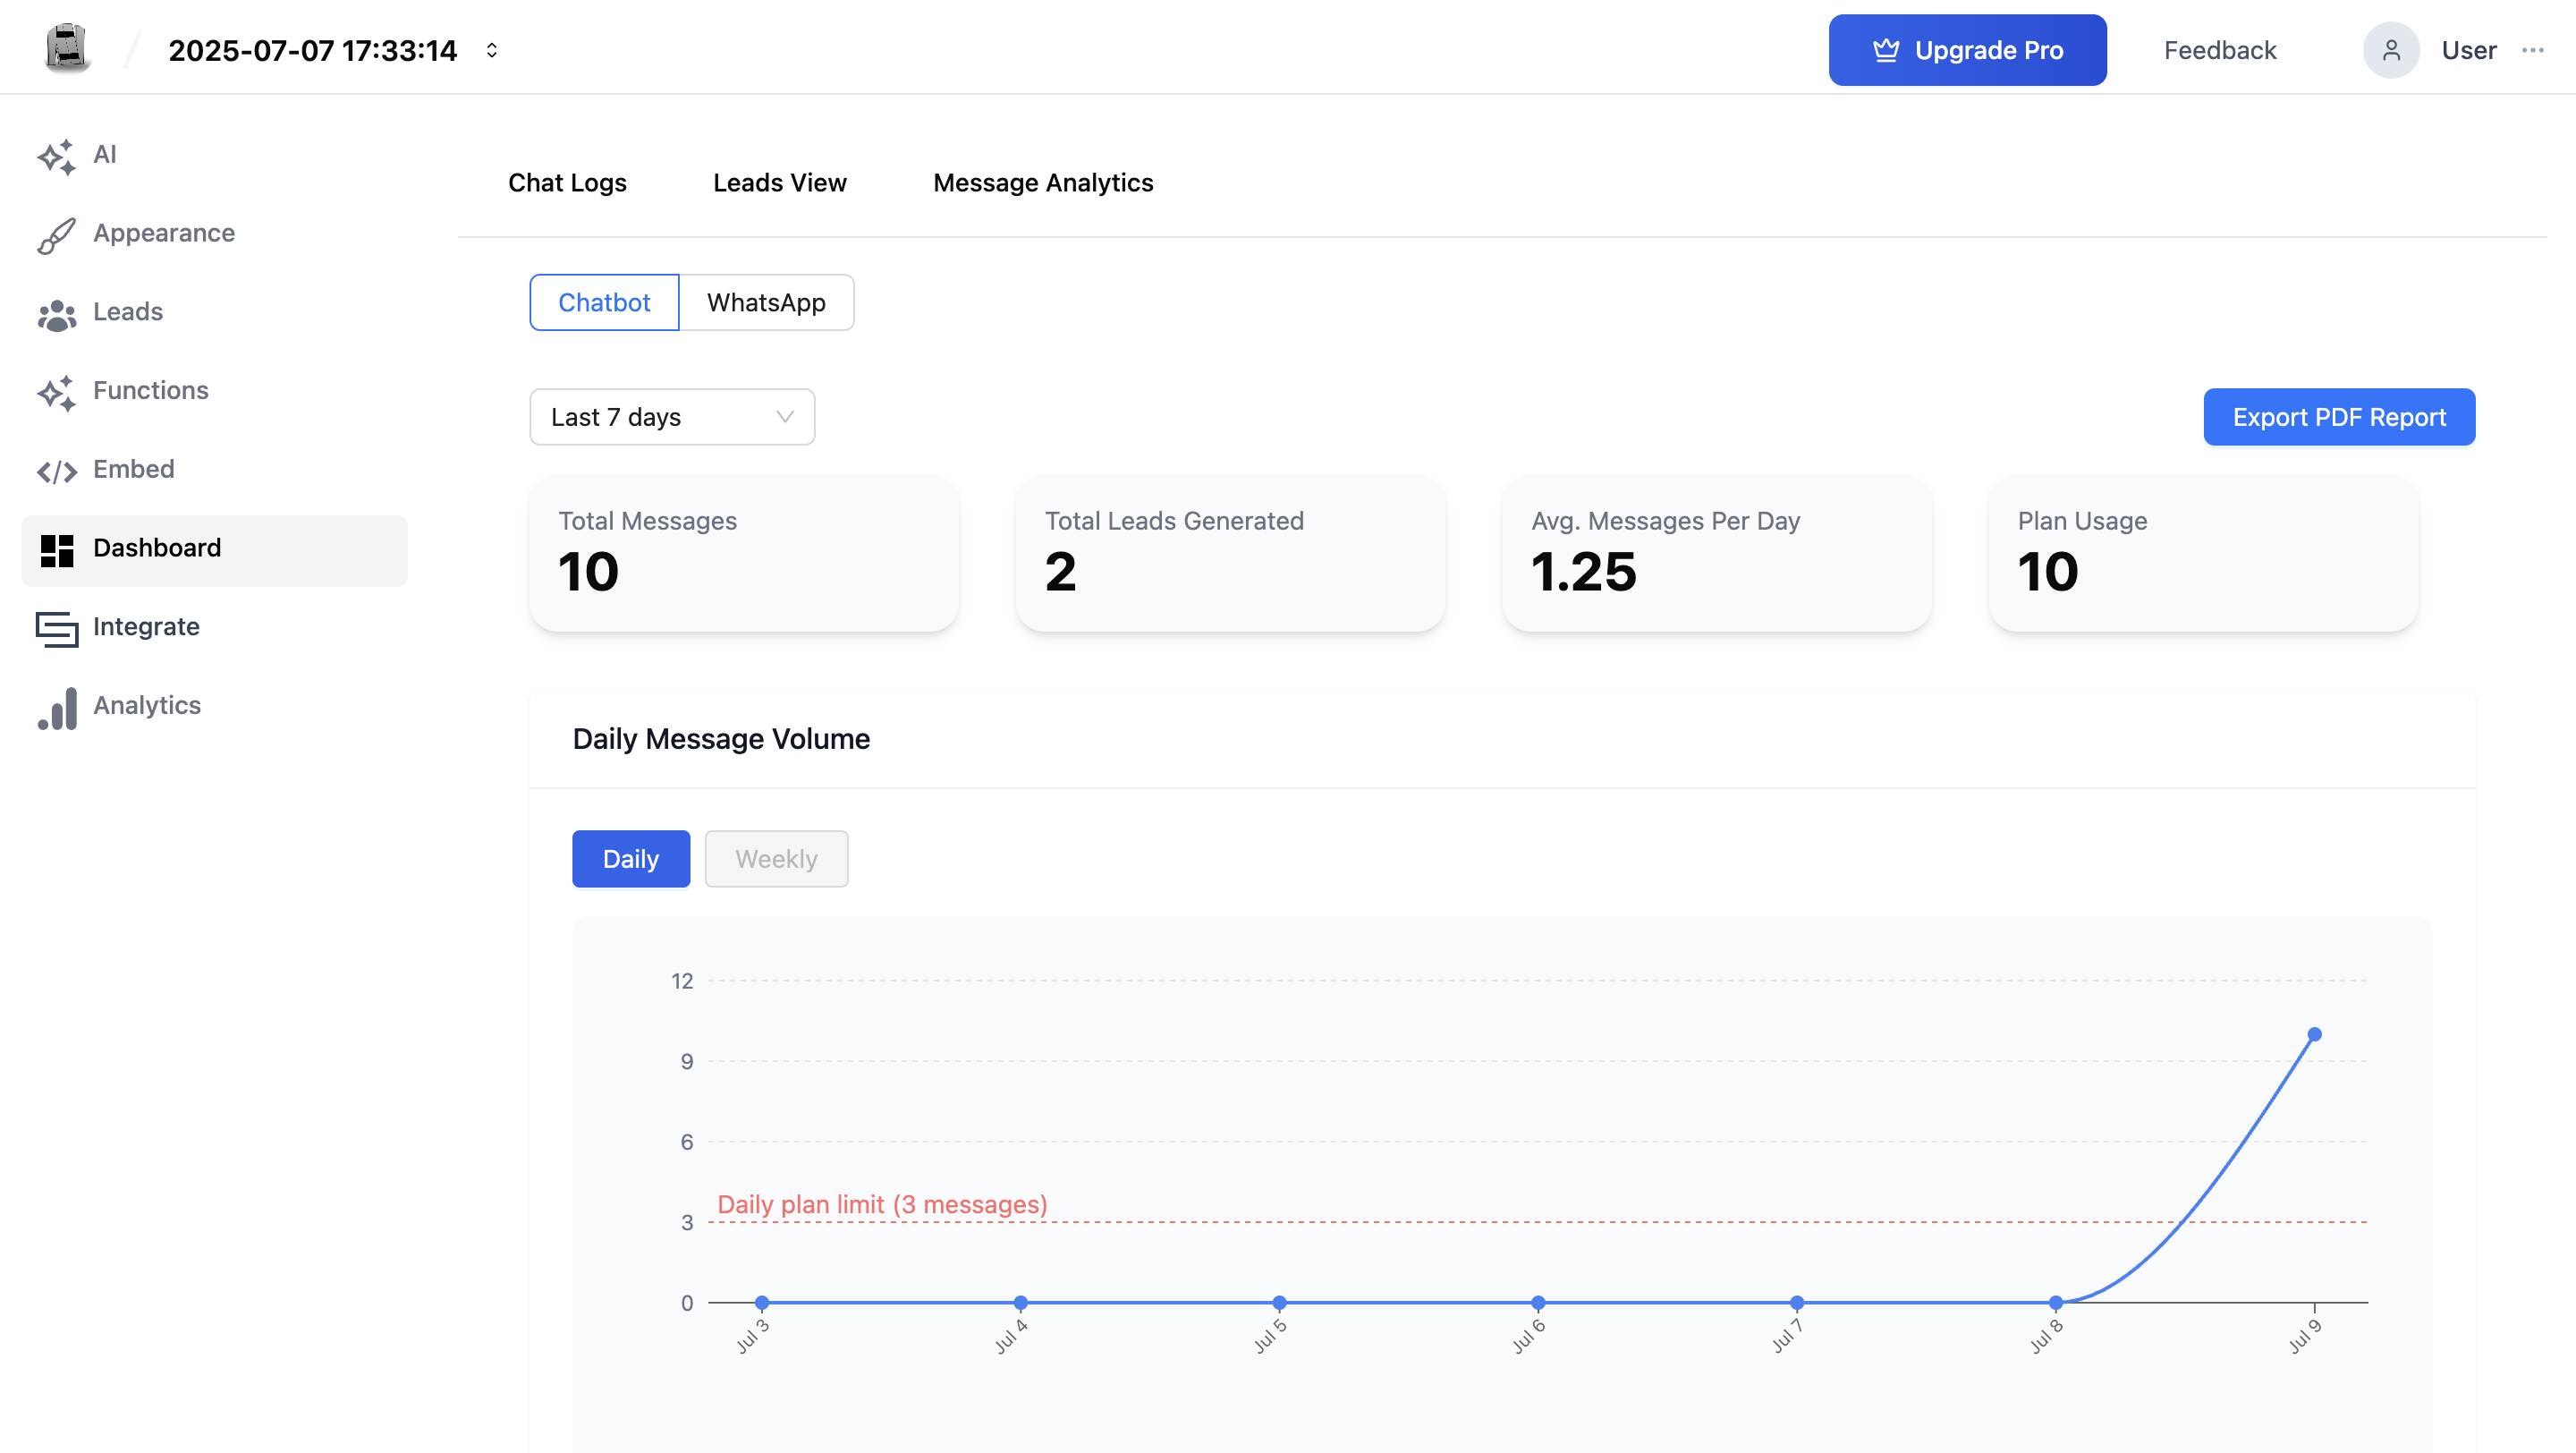
This centralized dashboard translates raw interaction data into key performance metrics, enabling you to optimize your conversational strategy and measure ROI.
1. Key Performance Indicators (KPIs)
Instantly assess the core health and effectiveness of your AI chat agent with these primary metrics.
- Total Messages: Quantify the overall interaction volume to measure bot activity and user adoption.
- Lead Generation: Track the exact number of qualified leads captured to measure sales pipeline contribution and conversion rates.
- Daily Interaction Rate: Monitor the average message volume to identify engagement trends and pinpoint peak activity hours.
- Plan Consumption: Track message usage against your subscription limits in real-time for effective resource management.
2. Performance Visualization
Analyze trends and patterns at a glance with dynamic, easy-to-read graphs.
- Interaction Volume Graph: Visualize message data with dynamic graphs, allowing you to toggle between daily and weekly breakdowns to spot performance trends instantly.
- Subscription Limit Overlay: A clear visual indicator on the graph tracks your consumption relative to your plan limits, helping you proactively manage your usage.
3. Reporting & Data Analysis
Isolate, analyze, and share your findings with powerful filtering and export tools.
- Granular Timeframe Filtering: Isolate specific date ranges to analyze performance during marketing campaigns, A/B tests, or specific business periods.
- One-Click PDF Reports: Instantly generate and export professional, shareable reports for stakeholder meetings, performance reviews, or archival.
Example View
Lead Integration in Chat Logs
Embedded View
Rather than a separate panel, lead data is dynamically displayed inside the Chat Logs panel if available during conversation.
How It Works
- When a user submits lead info (name, email, phone), it shows on the side within the same chat view.
- Also includes metadata like IP address, country, and city.
Benefit
Users can analyze the lead's path from conversation to conversion without switching panels.
Example View
Metric Definitions
| Metric | Description |
|---|---|
| Total Messages | Number of messages exchanged between bot and users. |
| Total Leads Generated | Users who submitted name/email/phone during chats. |
| Avg. Messages Per Day | Average message volume calculated over date range. |
| Plan Usage | Messages used out of allotted quota for current plan. |
Export & Reporting Features
Export options are available across all panels:
- Chat Logs: Export filtered conversations in PDF format.
- Analytics: Export graphs and key metrics as professional reports.
All exports are filter-aware, meaning only what is currently visible/downloaded is exported.
Unified Experience
Kipps.AI delivers a unified, interactive experience by tightly integrating chat monitoring, lead generation, and message analytics. Users can go from viewing a message to identifying a lead, analyzing traffic patterns, and exporting relevant reports without leaving the dashboard.
This seamless design streamlines user engagement tracking and supports strategic decisions around bot performance, content updates, and lead nurturing workflows.
Summary
The Kipps.AI dashboard empowers users with a real-time, data-rich environment for AI Chat Agent performance management. From tracking detailed conversations to managing lead data and understanding message trends, this dashboard offers all the tools necessary for operating a high-performance AI Chat Agent strategy.
Whether you are in sales, marketing, support, or product, Kipps.AI helps transform automated conversations into measurable business results.
Troubleshooting
The Chat Logs panel shows no conversations even though the agent is live. Confirm the agent is properly embedded on your website and that the embed code is present on pages users actually visit. Open browser developer tools on the page where the agent is embedded and check the console for JavaScript errors. Also verify that the date range filter in the Chat Logs panel is set to a period that includes your agent's activity.
Lead data is missing from conversations where users clearly shared their contact info. Lead capture requires either an active lead form configured in the agent's appearance settings or the user typing contact info in a format the agent recognizes. If leads are still not captured, check the agent's lead settings and confirm the form is enabled and mapped to the correct fields (name, email, phone).
The analytics graph shows zero messages for a date range when I know conversations occurred. Analytics data can take up to a few minutes to update after conversations complete. If the delay is longer, ensure you are viewing the correct agent's dashboard—each agent has its own analytics view. Use the date range filter to broaden the window and confirm the right agent is selected.
PDF export only includes some conversations, not all. PDF exports respect the active filter state. If you have a date range, email filter, or URL filter applied, only matching conversations are exported. Clear all filters to export the full conversation history, or adjust filters to target the specific subset you need.
Frequently Asked Questions
How long are chat logs stored in the dashboard? Chat log retention depends on your Kipps.AI subscription plan. Logs are accessible in the dashboard for the retention period defined by your plan. Export conversations as PDF if you need long-term archives beyond the retention window.
Can I filter conversations by a specific page URL where the chat widget was embedded? Yes. The Chat Logs filter includes a URL field, allowing you to isolate conversations that originated from a specific page on your website. This is useful for tracking agent performance on landing pages, product pages, or support pages separately.
Is the lead data captured in the dashboard automatically synced to a CRM? Lead data appears in the Leads View panel in real time. To sync leads to a CRM, use the Kipps.AI integration options (such as Zoho) or export the leads manually and import them into your CRM. Automatic CRM sync requires a configured integration.
What does "Plan Consumption" mean in the KPI section? Plan Consumption shows the percentage of your subscription's monthly message quota that has been used. When this approaches 100%, your agent may throttle or stop responding depending on your plan. Upgrade your plan or reduce usage to stay within limits.
Can multiple team members view the same dashboard simultaneously? Yes. The dashboard is accessible to all team members with appropriate roles in your Kipps.AI organization. Admins can manage role-based access to control who can view analytics, export data, or modify agent settings.
Related Articles